Market Outlook
August 03, 2017
Market Cues
Domestic Indices
Chg (%)
(Pts)
(Close)
Indian markets are likely to open flat tracking global indices and SGX Nifty.
BSE Sensex
(0.3)
(98)
32,477
U.S. markets had a mixed session as investors awaited the Labor Department's
Nifty
(0.3)
(33)
10,082
monthly jobs report on Friday. The ADP jobs report said private sector employment
Mid Cap
(0.3)
(46)
15,412
climbed by 178,000 jobs in July against an expected increase of about 185,000
Small Cap
(0.1)
(11)
16,063
jobs. In stocks, natural gas stocks saw significant weakness, with the NYSE Arca
Natural Gas Index dropping by 2.6 percent.
Bankex
(0.2)
(47)
28,356
UK markets moved slightly lower as mixed earnings, a strong pound and larger than
Global Indices
Chg (%)
(Pts)
(Close)
expected oil inventory levels affected investor sentiment. In addition, survey data
from IHS Markit showed that U.K. construction activity growth dropped to an 11-
Dow Jones
0.2
152
22,016
month low of 51.9 in July. The headline index dropped to 51.9 from 54.8 in June.
Nasdaq
(0.0)
(0)
6,363
Mining company Rio Tinto fell 2 percent after its reported profit came in below
FTSE
(0.2)
(12)
7,411
consensus expectations.
Nikkei
(00.5
94
20,080
Indian markets closed lower in spite of RBI lowering interest rates by 25 basis points
Hang Seng
0.2
267
27,607
and inflation coming in lower. The Consumer Durables index reversed some of
Shanghai Com
(0.2)
(8)
1
3,285
yesterday’s losses and closed up 1.1 percent for the session. The IT index closed
down 0.9 percent as the rupee reached a 2-year high.
Advances / Declines
BSE
NSE
Result Review
Advances
1,050
1,658
Lupin (CMP: `1030 / TP:`1526 /Upside: 48.1%)
Declines
1,620
1,045
Unchanged
180
72
Detailed analysis is on Pg2
Investor’s Ready Reckoner
Volumes (` Cr)
Key Domestic & Global Indicators
BSE
3,037
Stock Watch: Latest investment recommendations on 150+ stocks
NSE
24,103
Refer Pg7 onwards
#Net Inflows (` Cr)
Net
Mtd
Ytd
Top Picks
CMP
Target
Upside
Company
Sector
Rating
FII
(5(920)
(2(920)
57,477
(`)
(`)
(%)
MFs
8455
4,455
51,400
Blue Star
Capital Goods
Accumulate
683
760
11.3
Dewan Housing FinanceFinancials
Buy
461
550
19.4
Mahindra Lifespace
Real Estate
Buy
423
522
23.5
Top Gainers
Price (`)
Chg (%)
Navkar Corporation
Others
Buy
200
265
32.4
Balramchin
172
6.0
KEI Industries
Capital Goods
Accumulate
227
258
13.8
More Top Picks on Pg5
Renuka
19
5.3
Edelweiss
215
5.3
Key Upcoming Events
Strtech
221
4.3
Previous
Consensus
Date
Region
Event Description
Reading
Expectations
Apollotyre
277
4.2
Aug 03, 2017 India
RBI Cash Reserve ratio
4.00
4.00
Aug 03, 2017 Germany PMI Services
53.50
53.50
Top Losers
Price (`)
Chg (%)
Aug 03, 2017 US
Unnemployment rate
4.40
4.30
Jpassociat
226
(8.8)
Aug 04, 2017 UK
BOE Announces rates
0.25
0.25
Aug 04, 2017 US
Change in Nonfarm payrolls
222.00
180.00
Hindcopper
65
(7.9)
More Events on Pg7
Infibeam
1,379
(4.6)
Videoind
23
(4.4)
Unitech
8
(4.3)
#as on 2st Aug, 2017
Market Outlook
August 03, 2017
Result Review
Lupin (CMP: `1030 / TP:`1526 /Upside: 48.1%)
Lupin for 1QFY2018 posted bad set of numbers. Sales came in at `3,806cr V/s
`4,316cr expected and V/s `4,3418cr in 4QFY2017, a yoy de-growth of 12.3%.
The dip was mainly on back of the formulation sales (`3,528cr) which declined by
12.8%, mainly on back of a 26.8% dip in the USA (`1,602cr; accounting for 42%
of global sales). Lupin’s India formulation sales grew by 6.1% to `932.4cr during
1QFY2018 as compared to 4QFY2017 and decreased by 1.8% compared to
1QFY2017; accounting for 25% of Lupin’s global sales. Lupin’s APAC sales were
at `599cr during 1QFY2018 compared to sales of `6,12cr during 4QFY2017 and
`5,42cr during 1QFY2017; accounting for 16% of Lupin’s global sales.
On operating front, the EBITDA margins came in at 18.5% V/s 22.9% expected V/s
27.4% in 1QFY2017, mainly on back of lower than expected sales during the
quarter and dip in the gross margins. Gross margins came in at 67.6% V/s 70.5%
in 1QFY2017; which along with the lower rise in expenses lead the OPM to come
in at 18.5% V/s 27.4% in the last corresponding period. Employee, R&D and other
expenses have risen by 1.7%, 0.1% and (0.5)% respectively. R&D expenses were
13.1% of sales in 1QFY2018 V/s 11.6% of sales in 1QFY2017. Thus, the PAT
came in at `358cr V/s `607cr expected V/s `882cr in 1QFY2017, a yoy de-
growth of 59.4%. Tax rate during the quarter was 27.7% of PBT V/s 23.6% of PBT
in 1QFY2017. We maintain our buy rating on the stock.
Y/E
Sales OPM
PAT
EPS ROE P/E P/BV EV/EBITDA EV/Sales
March
(` cr)
(%)
(` cr)
(`)
(%)
(x)
(x)
(x)
(x)
FY2018E
18,657
24.1
2,748
61.1
18.6
16.9
2.9
10.5
2.5
FY2019E
21,289
24.1
3,115
69.3
17.8
14.9
2.5
8.6
2.1
Economic and Political News
Rupee rallies 37 paise; climbs to 2 year high of 63.70
RBI rate cut to probably lead to lower interest rate on home loans, act as boost
to housing sales: Experts
Hindustan Copper OFS attracts bids for 50.5 million shares from institutional
investors against 29.6 million shares offered.
Corporate News
No proposal yet to merge BSNL, MTNL: Union Minister
Reliance Infra Q1 net profit dips 24% YoY at `334cr
IOC to source 10% of oil requirement through internal sources
Market Outlook
August 03, 2017
Quarterly Bloomberg Brokers Consensus Estimate
Indian Oil Corp Ltd - Aug 3, 2017
Particulars ( ` cr)
1QFY18E
1QFY17
y-o-y (%)
4QFY17 q-o-q (%)
Net sales
95,329
85,655
11.3
100,338
(5.0)
EBITDA
6,317
13,684
(53.8)
4,409
43.3
EBITDA margin (%)
6.6
16.0
4.4
Net profit
3,023
8,269
(63.4)
3,721
(18.7)
Titan Company Ltd - Aug 3, 2017
Particulars ( ` cr)
1QFY18E
1QFY17
y-o-y (%)
4QFY17 q-o-q (%)
Net sales
3,478
2,783
25.0
3,430
1.4
EBITDA
350
292
19.9
272
28.7
EBITDA margin (%)
10.1
10.5
7.9
Net profit
247
127
95.2
202
22.3
Cummins India Ltd - Aug 3, 2017
Particulars ( ` cr)
1QFY18E
1QFY17
y-o-y (%)
4QFY17 q-o-q (%)
Net sales
1,326
1,228
8.0
1,156
14.8
EBITDA
198
206
(4.3)
170
16.2
EBITDA margin (%)
14.9
16.8
14.7
Net profit
185
181
2.2
158
16.8
Market Outlook
August 03, 2017
Top Picks
Market Cap
CMP
Target
Upside
Company
Rationale
(` Cr)
(`)
(`)
(%)
Strong growth in domestic business due to its leadership
in acute therapeutic segment. Alkem expects to launch
Alkem Laboratories
21,478
1,796
2,161
20.3
more products in USA, which bodes for its international
business.
We expect the company would report strong profitability
Asian Granito
1,228
408
480
17.6
owing to better product mix, higher B2C sales and
amalgamation synergy.
Favourable outlook for the AC industry to augur well for
Cooling products business which is out pacing the
Blue Star
6,539
683
760
11.3
market growth. EMPPAC division's profitability to improve
once operating environment turns around.
With a focus on the low and medium income (LMI)
consumer segment, the company has increased its
Dewan Housing Finance
14,448
461
550
19.4
presence in tier-II & III cities where the growth
opportunity is immense.
Loan growth is likely to pick up after a sluggish FY17.
Karur Vysya Bank
8,424
139
160
14.8
Lower credit cost will help in strong bottomline growth.
Increasing share of CASA will help in NIM improvement.
High order book execution in EPC segment, rising B2C
KEI Industries
1,764
227
258
13.8
sales and higher exports to boost the revenues and
profitability
Speedier execution and speedier sales, strong revenue
Mahindra Lifespace
2,169
423
522
23.5
visibilty in short-to-long run, attractive valuations
Massive capacity expansion along with rail advantage at
Navkar Corporation
2,854
200
265
32.4
ICD as well CFS augurs well for the company
Strong brands and distribution network would boost
Siyaram Silk Mills
1,961
2,092
2,500
19.5
growth going ahead. Stock currently trades at an
inexpensive valuation.
Market leadership in Hindi news genre and no.
2
viewership ranking in English news genre, exit from the
TV Today Network
1,442
242
344
42.3
radio business, and anticipated growth in ad spends by
corporates to benefit the stock.
After GST, the company is expected to see higher
volumes along with improving product mix. The Gujarat
Maruti
2,36,097
7,816
8,495
8.7
plant will also enable higher operating leverage which
will be margin accretive.
Source: Company, Angel Research,
Market Outlook
August 03, 2017
Key Upcoming Events
Result Calendar
Date
Company
CEAT, Cummins India, J K Lakshmi Cements, Electrosteel Castings, IOC, Bajaj Electrical, Elecon
August 03, 2017
Engineering
August 04, 2017
M&M, Apollo Tyres, Andhra Bank, Dabur India, HPCL, MRF, Kirloskar Engines India Ltd, VRL Logistics
Source: Bloomberg, Angel Research
Global economic events release calendar
Bloomberg Data
Date
Time
Country
Event Description
Unit
Period
Last Reported
Estimated
Aug 03, 2017
2:30 PMIndia
RBI Cash Reserve ratio
%
Aug 2
4.00
4.00
1:25 PMGermany PMI Services
Value
Jul F
53.50
53.50
6:00 PMUS
Unnemployment rate
%
Jul
4.40
4.30
Aug 04, 2017
4:30 PMUK
BOE Announces rates
% Ratio
Aug 3
0.25
0.25
6:00 PMUS
Change in Nonfarm payrolls
Thousands
Jul
222.00
180.00
Aug 08, 2017
China
Exports YoY%
% Change
Jul
11.30
11.00
Aug 09, 2017
7:00 AMChina
Consumer Price Index (YoY)
% Change
Jul
1.50
1.50
Aug 10, 2017
India
Imports YoY%
% Change
Jul
19.00
India
Exports YoY%
% Change
Jul
4.40
US
Producer Price Index (mom)
% Change
Jul
0.20
2:00 PMUK
Industrial Production (YoY)
% Change
Jun
(0.20)
Aug 11, 2017
6:00 PMUS
Consumer price index (mom)
% Change
Jul
-
0.10
5:30 PMIndia
Industrial Production YoY
% Change
Jun
1.70
Aug 14, 2017
7:30 AMChina
Industrial Production (YoY)
% Change
Jul
7.60
7.20
2:00 PMUK
CPI (YoY)
% Change
Jul
2.60
Source: Bloomberg, Angel Research
Market Outlook
August 03, 2017
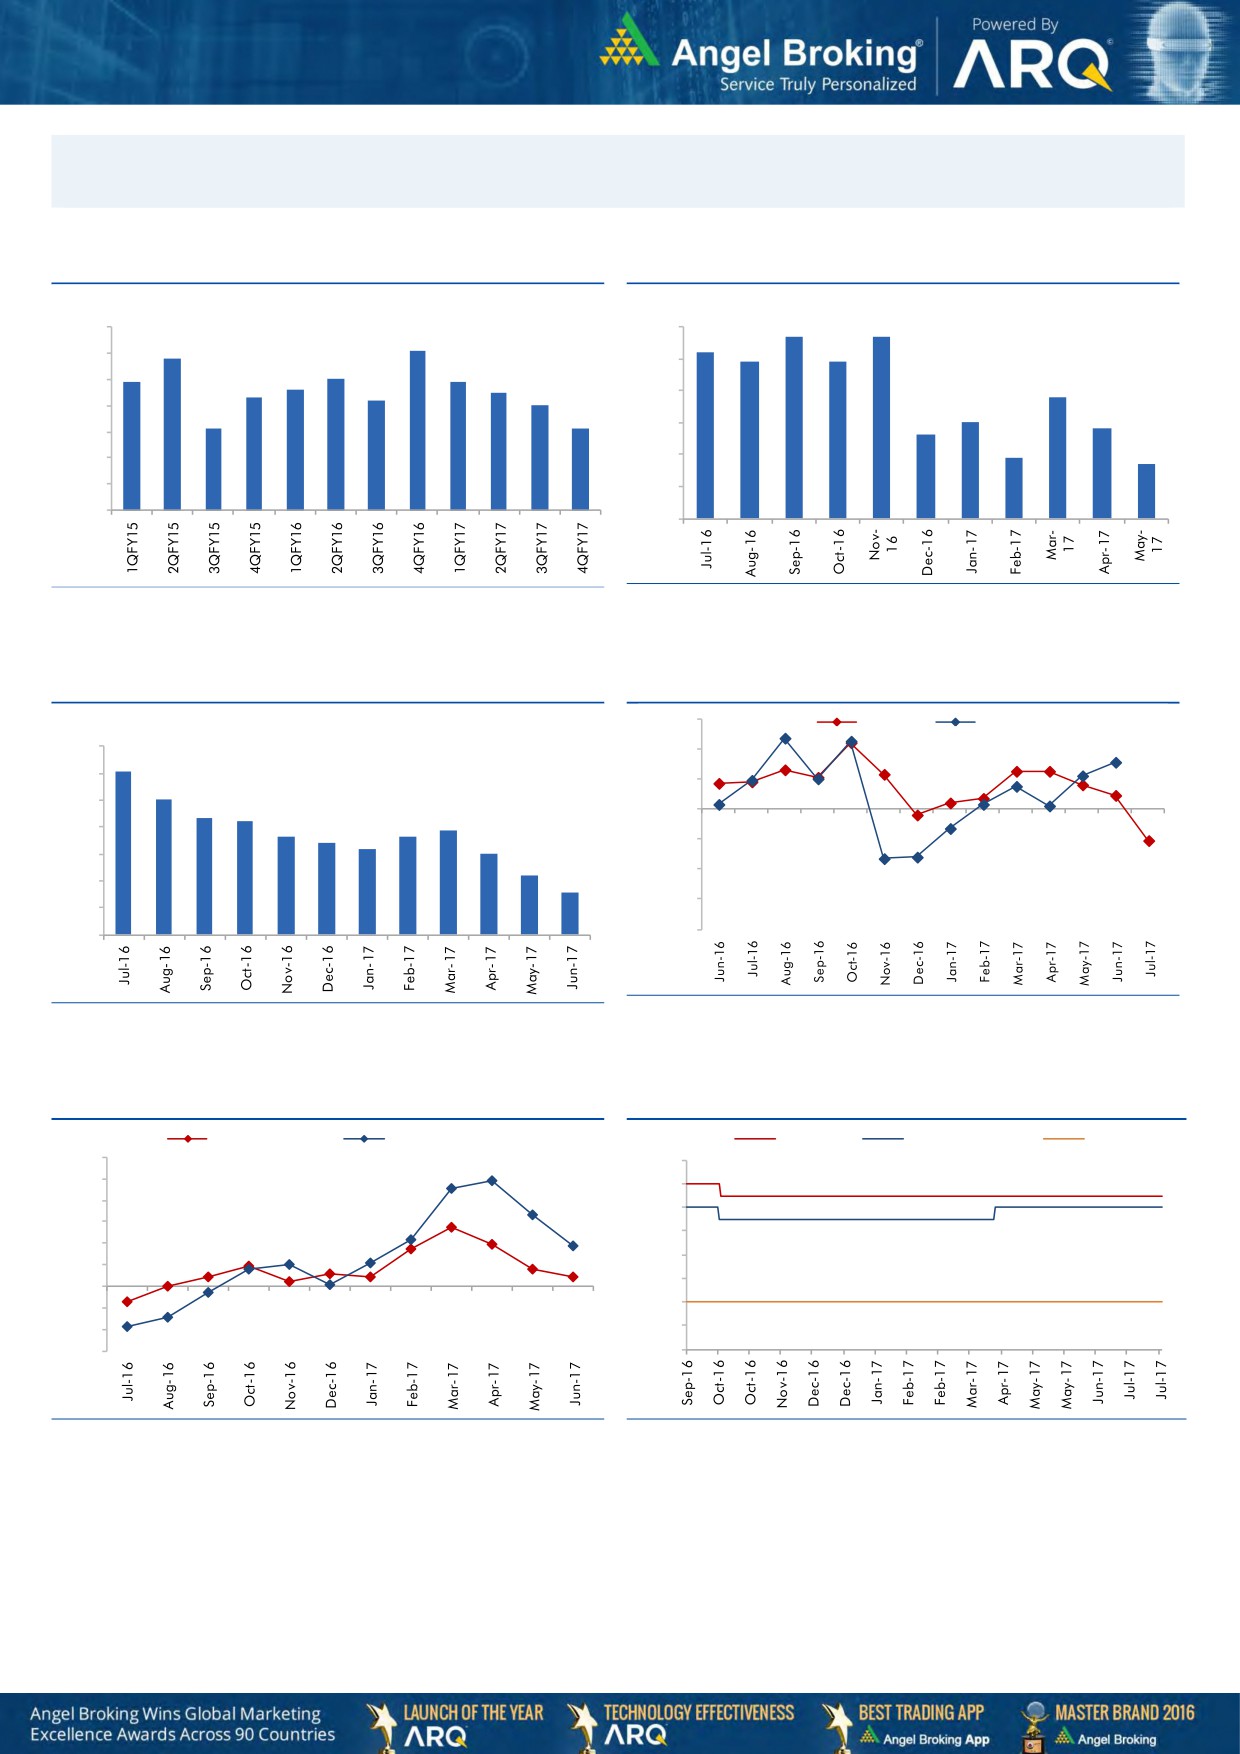
Macro watch
Exhibit 1: Quarterly GDP trends
Exhibit 2: IIP trends
(%)
(%)
5.7
5.7
10.0
6.0
9.1
5.2
8.8
4.9
4.9
9.0
7.9
8.0
7.9
5.0
7.6
7.5
8.0
7.3
7.2
3.8
7.0
4.0
7.0
3.0
6.1
6.1
2.8
3.0
2.6
6.0
1.9
1.7
5.0
2.0
4.0
1.0
3.0
-
Source: CSO, Angel Research
Source: MOSPI, Angel Research
Exhibit 3: Monthly CPI inflation trends
Exhibit 4: Manufacturing and services PMI
56.0
Mfg. PMI
Services PMI
(%)
7.0
54.0
6.1
6.0
5.1
52.0
5.0
4.3
4.2
3.9
50.0
3.6
3.7
4.0
3.4
3.2
3.0
48.0
3.0
2.2
46.0
2.0
1.5
44.0
1.0
42.0
-
Source: Market, Angel Research; Note: Level above 50 indicates expansion
Source: MOSPI, Angel Research
Exhibit 5: Exports and imports growth trends
Exhibit 6: Key policy rates
(%)
Exports yoy growth
Imports yoy growth
(%)
Repo rate
Reverse Repo rate
CRR
60.0
7.00
50.0
6.50
40.0
6.00
30.0
5.50
20.0
5.00
10.0
4.50
0.0
4.00
(10.0)
(20.0)
3.50
(30.0)
3.00
Source: Bloomberg, Angel Research
Source: RBI, Angel Research
Market Outlook
August 03, 2017
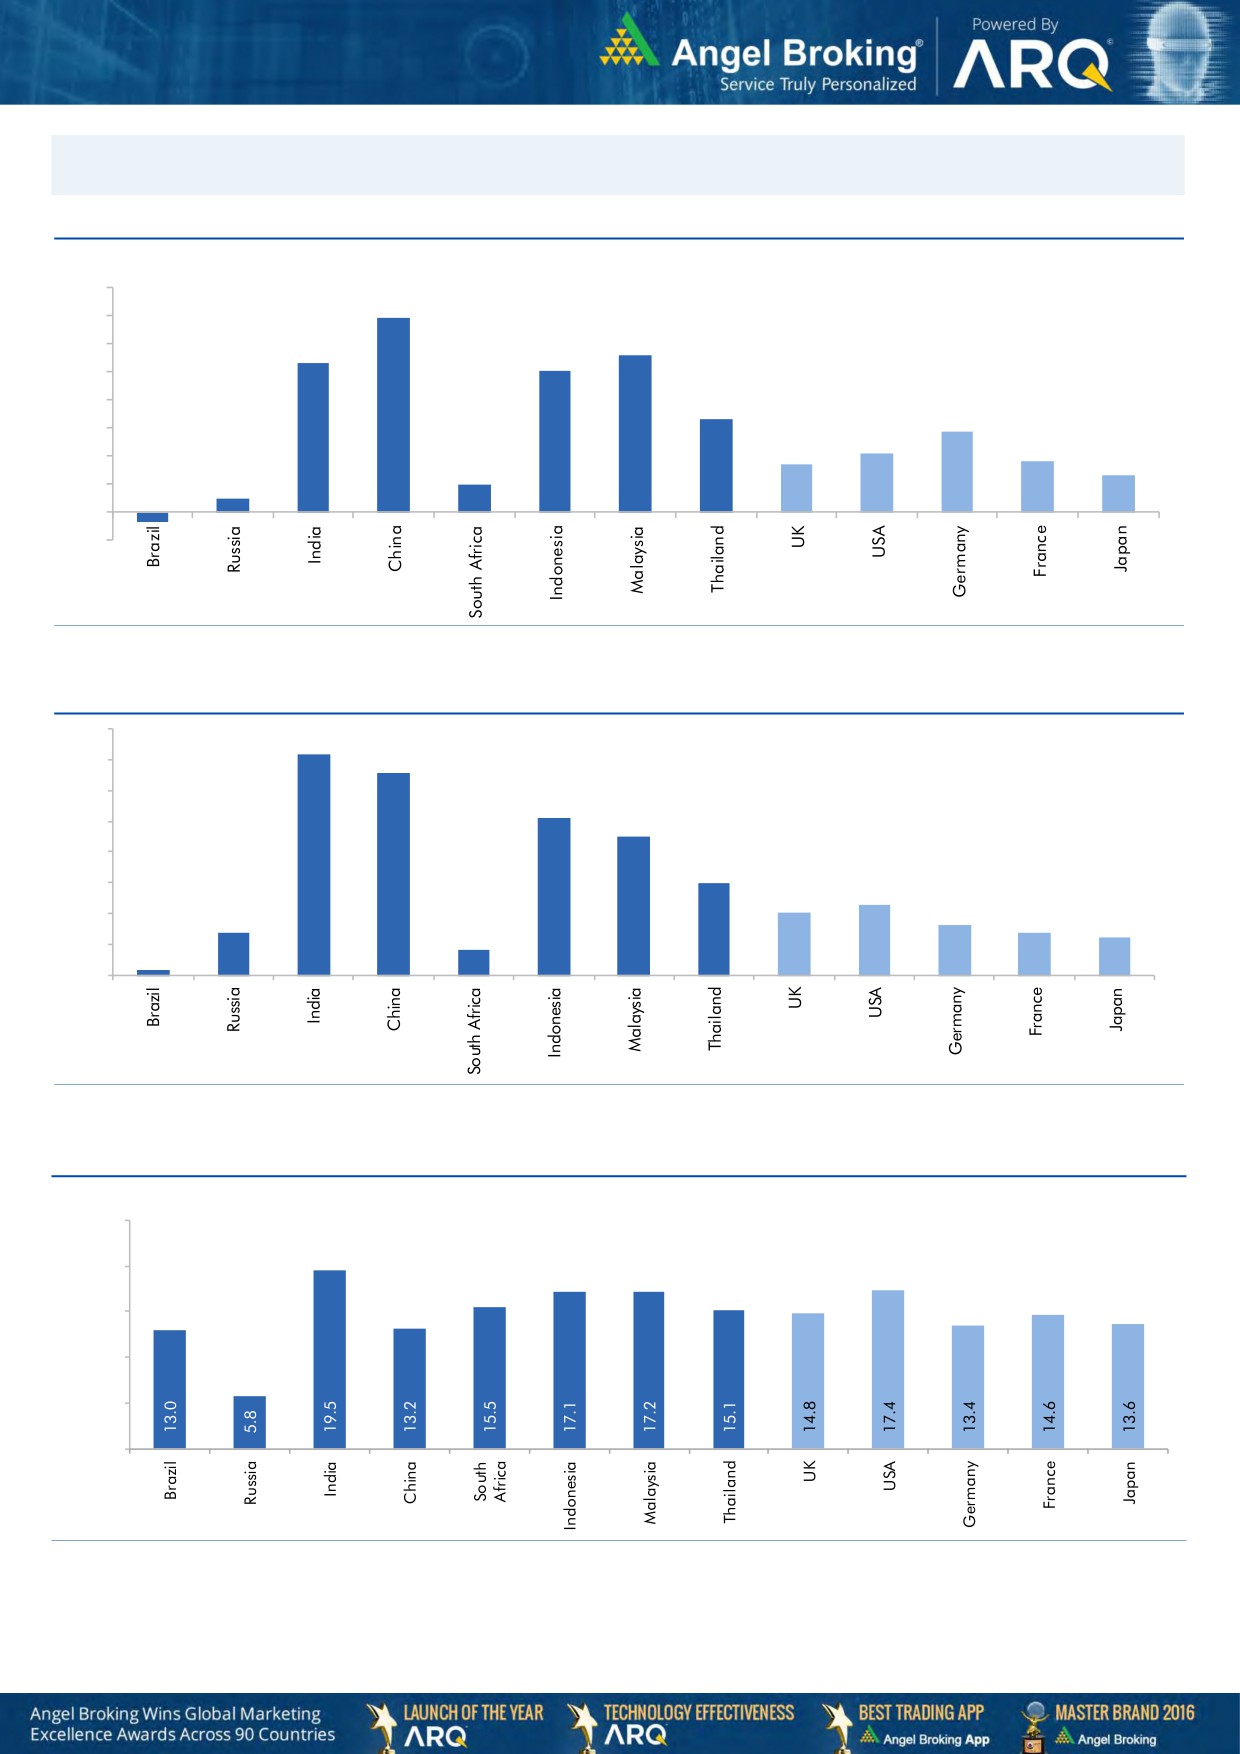
Global watch
Exhibit 1: Latest quarterly GDP Growth (%, yoy) across select developing and developed countries
(%)
8.0
6.9
7.0
5.6
6.0
5.3
5.0
1.0
5.0
4.0
3.3
2.9
3.0
2.1
1.7
1.8
0.5
2.0
1.3
1.0
-
(1.0)
(0.4)
Source: Bloomberg, Angel Research
Exhibit 2: 2016 GDP Growth projection by IMF (%, yoy) across select developing and developed countries
(%)
7.2
7.0
6.6
6.0
5.1
5.0
4.5
4.0
3.0
3.0
2.3
2.0
1.4
1.6
2.0
1.4
1.2
0.2
0.8
1.0
-
Source: IMF, Angel Research
Exhibit 3: One year forward P-E ratio across select developing and developed countries
(x)
25.0
20.0
15.0
10.0
5.0
-
Source: IMF, Angel Research
Market Outlook
August 03, 2017
Exhibit 4: Relative performance of indices across globe
Returns (%)
Country
Name of index
Closing price
1M
3M
1YR
Brazil
Bovespa
67,136
6.1
1.6
17.1
Russia
Micex
1,965
3.3
(2.5)
1.1
India
Nifty
10,082
4.9
8.3
16.3
China
Shanghai Composite
3,285
3.0
4.6
8.9
South Africa
Top 40
48,811
6.1
4.0
6.3
Mexico
Mexbol
51,200
2.2
4.5
9.3
Indonesia
LQ45
972
(1.9)
5.0
6.9
Malaysia
KLCI
1,771
0.1
0.2
6.6
Thailand
SET 50
1,005
1.0
1.1
4.7
USA
Dow Jones
22,016
3.1
5.1
19.9
UK
FTSE
7,411
0.5
2.4
10.0
Japan
Nikkei
20,080
0.2
4.6
22.6
Germany
DAX
12,181
(2.4)
(2.8)
16.8
France
CAC
5,107
(1.7)
(4.9)
14.7
Source: Bloomberg, Angel Research
Stock Watch
August 03, 2017
Company Name
Reco
CMP
Target
Mkt Cap
Sales ( Čcr )
OPM(%)
EPS (Č)
PER(x)
P/BV(x)
RoE(%)
EV/Sales(x)
(Č)
Price ( Č)
( Č cr )
FY17E FY18E
FY17E
FY18E
FY17E
FY18E
FY17E
FY18E
FY17E
FY18E
FY17E
FY18E
FY17E
FY18E
Agri / Agri Chemical
Rallis
Reduce
244
209
4,742
1,937
2,164
13.3
14.3
9.0
11.0
27.1
22.2
4.7
4.1
18.4
19.8
2.5
2.2
United Phosphorus
Neutral
889
-
45,141
15,176
17,604
18.5
18.5
37.4
44.6
23.8
19.9
4.7
3.9
21.4
21.2
3.1
2.6
Auto & Auto Ancillary
Ashok Leyland
Accumulate
109
116
31,929
20,019
22,789
11.1
11.7
4.3
5.5
25.4
19.9
4.9
4.4
19.4
22.0
1.5
1.3
Bajaj Auto
Neutral
2,802
-
81,082
25,093
27,891
19.5
19.2
143.9
162.5
19.5
17.3
5.5
4.7
30.3
29.4
3.0
2.6
Bharat Forge
Neutral
1,155
-
26,896
7,726
8,713
20.5
21.2
35.3
42.7
32.7
27.1
6.0
5.5
18.9
20.1
3.5
3.1
Eicher Motors
Neutral
31,154
-
84,807
16,583
20,447
17.5
18.0
598.0
745.2
52.1
41.8
17.8
13.6
41.2
38.3
4.9
3.9
Gabriel India
Neutral
167
-
2,398
1,544
1,715
9.0
9.3
5.4
6.3
30.9
26.5
5.8
5.2
18.9
19.5
1.5
1.3
Hero Motocorp
Neutral
3,800
-
75,892
28,120
30,753
15.2
15.6
169.1
189.2
22.5
20.1
7.7
6.5
30.8
28.2
2.5
2.3
Jamna Auto Industries Neutral
265
-
2,115
1,486
1,620
9.8
9.9
15.0
17.2
17.7
15.4
3.9
3.3
21.8
21.3
1.5
1.4
L G Balakrishnan & Bros Neutral
765
-
1,201
1,302
1,432
11.6
11.9
43.7
53.0
17.5
14.4
2.5
2.2
13.8
14.2
1.0
0.9
Mahindra and Mahindra Neutral
1,415
-
87,894
46,534
53,077
11.6
11.7
67.3
78.1
21.0
18.1
3.4
3.0
15.4
15.8
1.9
1.6
Maruti
Accumulate
7,816
8,495
236,097
67,822
83,717
15.2
15.0
243.0
291.5
32.2
26.8
7.4
6.0
22.9
22.4
3.2
2.5
Minda Industries
Neutral
787
-
6,805
2,728
3,042
9.0
9.1
68.2
86.2
11.6
9.1
2.6
2.1
23.8
24.3
2.6
2.3
Motherson Sumi
Neutral
333
-
70,071
45,896
53,687
7.8
8.3
13.0
16.1
25.5
20.7
8.2
6.6
34.7
35.4
1.6
1.3
Rane Brake Lining
Neutral
1,290
-
1,021
511
562
11.3
11.5
28.1
30.9
45.9
41.7
7.0
6.4
15.3
15.0
2.1
2.0
Setco Automotive
Neutral
39
-
525
741
837
13.0
13.0
15.2
17.0
2.6
2.3
0.4
0.4
15.8
16.3
1.1
1.0
Tata Motors
Neutral
440
-
126,899
300,209
338,549
8.9
8.4
42.7
54.3
10.3
8.1
1.7
1.4
15.6
17.2
0.5
0.5
TVS Motor
Neutral
591
-
28,061
13,390
15,948
6.9
7.1
12.8
16.5
46.3
35.7
11.5
9.1
26.3
27.2
2.1
1.8
Amara Raja Batteries
Accumulate
840
962
14,356
5,339
6,220
15.9
15.3
28.0
32.3
30.0
26.0
5.7
4.8
19.1
18.5
2.7
2.3
Exide Industries
Neutral
222
-
18,832
7,439
8,307
15.0
15.0
8.1
9.3
27.4
23.8
3.8
3.4
14.3
16.7
2.1
1.9
Apollo Tyres
Neutral
277
-
14,115
12,877
14,504
14.3
13.9
21.4
23.0
12.9
12.1
2.0
1.8
16.4
15.2
1.3
1.2
Ceat
Neutral
1,926
-
7,791
7,524
8,624
13.0
12.7
131.1
144.3
14.7
13.4
2.7
2.3
19.8
18.6
1.1
1.0
JK Tyres
Neutral
169
-
3,840
7,455
8,056
15.0
15.0
21.8
24.5
7.8
6.9
1.6
1.3
22.8
21.3
0.6
0.6
Swaraj Engines
Neutral
2,077
-
2,579
660
810
15.2
16.4
54.5
72.8
38.1
28.5
11.9
10.8
31.5
39.2
3.7
3.0
Subros
Neutral
243
-
1,457
1,488
1,681
11.7
11.9
6.4
7.2
38.0
33.9
4.0
3.6
10.8
11.4
1.2
1.1
Indag Rubber
Neutral
195
-
512
286
326
19.8
16.8
11.7
13.3
16.7
14.6
2.8
2.6
17.8
17.1
1.5
1.3
Capital Goods
ACE
Neutral
69
-
685
709
814
4.1
4.6
1.4
2.1
49.5
33.0
2.0
1.9
4.4
6.0
1.1
1.0
BEML
Neutral
1,710
-
7,120
3,451
4,055
6.3
9.2
31.4
57.9
54.5
29.5
3.3
3.0
6.3
10.9
2.2
1.8
Bharat Electronics
Neutral
182
-
40,630
8,137
9,169
16.8
17.2
58.7
62.5
3.1
2.9
0.5
0.4
44.6
46.3
4.0
3.6
Stock Watch
August 03, 2017
Company Name
Reco
CMP
Target
Mkt Cap
Sales ( Čcr )
OPM(%)
EPS (Č)
PER(x)
P/BV(x)
RoE(%)
EV/Sales(x)
(Č)
Price ( Č)
( Č cr )
FY17E
FY18E
FY17E
FY18E
FY17E
FY18E
FY17E
FY18E
FY17E
FY18E
FY17E
FY18E
FY17E
FY18E
Capital Goods
Voltas
Neutral
540
-
17,873
6,511
7,514
7.9
8.7
12.9
16.3
41.9
33.1
7.5
6.6
16.7
18.5
2.5
2.1
BGR Energy
Neutral
146
-
1,057
16,567
33,848
6.0
5.6
7.8
5.9
18.8
24.8
1.1
1.0
4.7
4.2
0.2
0.1
BHEL
Neutral
141
-
34,597
28,797
34,742
-
2.8
2.3
6.9
61.5
20.5
1.0
1.0
1.3
4.8
0.9
0.6
Blue Star
Accumulate
683
760
6,539
4,283
5,077
5.9
7.3
14.9
22.1
45.9
30.9
8.9
7.5
20.4
26.4
1.6
1.3
CG Power and Industrial
Neutral
84
-
5,265
5,777
6,120
5.9
7.0
3.3
4.5
25.5
18.7
1.1
1.1
4.4
5.9
0.9
0.7
Solutions
Greaves Cotton
Neutral
161
-
3,921
1,755
1,881
16.8
16.9
7.8
8.5
20.6
18.9
4.1
3.8
20.6
20.9
1.9
1.8
Inox Wind
Neutral
135
-
2,993
5,605
6,267
15.7
16.4
24.8
30.0
5.4
4.5
1.5
1.1
25.9
24.4
0.6
0.5
KEC International
Neutral
299
-
7,681
9,294
10,186
7.9
8.1
9.9
11.9
30.2
25.1
4.4
3.8
15.6
16.3
1.1
1.0
KEI Industries
Accumulate
227
258
1,764
2,633
3,001
10.4
10.0
12.7
13.0
17.8
17.4
3.8
3.2
21.4
18.2
0.9
0.8
Thermax
Neutral
875
-
10,428
5,421
5,940
7.3
7.3
25.7
30.2
34.1
29.0
4.1
3.8
12.2
13.1
1.8
1.7
VATech Wabag
Accumulate
613
681
3,347
3,136
3,845
8.9
9.1
26.0
35.9
23.6
17.1
3.0
2.5
13.4
15.9
1.0
0.8
Cement
ACC
Neutral
1,770
-
33,233
11,225
13,172
13.2
16.9
44.5
75.5
39.8
23.4
3.8
3.5
11.2
14.2
3.0
2.5
Ambuja Cements
Neutral
266
-
52,759
9,350
10,979
18.2
22.5
5.8
9.5
45.8
28.0
3.9
3.5
10.2
12.5
5.6
4.8
India Cements
Neutral
201
-
6,185
4,364
4,997
18.5
19.2
7.9
11.3
25.4
17.8
1.8
1.8
8.0
8.5
2.2
1.9
JK Cement
Neutral
1,004
-
7,020
4,398
5,173
15.5
17.5
31.2
55.5
32.2
18.1
3.9
3.4
12.0
15.5
2.1
1.8
J K Lakshmi Cement
Neutral
456
-
5,361
2,913
3,412
14.5
19.5
7.5
22.5
60.8
20.3
3.7
3.1
12.5
18.0
2.4
2.0
Orient Cement
Neutral
152
-
3,112
2,114
2,558
18.5
20.5
8.1
11.3
18.8
13.4
2.8
2.3
9.0
14.0
2.1
1.6
UltraTech Cement
Neutral
4,090
-
112,271
25,768
30,385
21.0
23.5
111.0
160.0
36.8
25.6
4.7
4.1
13.5
15.8
4.5
3.7
Construction
ITNL
Neutral
90
-
2,974
8,946
10,017
31.0
31.6
8.1
9.1
11.2
9.9
0.4
0.4
4.2
5.0
3.7
3.4
KNR Constructions
Neutral
212
-
2,981
1,385
1,673
14.7
14.0
41.2
48.5
5.2
4.4
1.0
0.8
14.9
15.2
2.2
1.8
Larsen & Toubro
Buy
1,177
1,700
164,752
111,017
124,908
11.0
11.0
61.1
66.7
19.3
17.6
2.3
2.1
13.1
12.9
2.5
2.3
Gujarat Pipavav Port
Neutral
144
-
6,962
705
788
52.2
51.7
5.0
5.6
28.8
25.7
2.8
2.6
11.2
11.2
9.5
8.0
Nagarjuna Const.
Neutral
90
-
5,017
8,842
9,775
9.1
8.8
5.3
6.4
17.0
14.1
1.4
1.2
8.2
9.1
0.7
0.6
PNC Infratech
Neutral
140
-
3,603
2,350
2,904
13.1
13.2
9.0
8.8
15.6
16.0
0.6
0.5
15.9
13.9
1.7
1.3
Simplex Infra
Neutral
466
-
2,306
6,829
7,954
10.5
10.5
31.4
37.4
14.8
12.5
1.5
1.4
9.9
13.4
0.8
0.6
Power Mech Projects
Neutral
585
-
861
1,801
2,219
12.7
14.6
72.1
113.9
8.1
5.1
1.5
1.3
16.8
11.9
0.5
0.4
Sadbhav Engineering
Neutral
291
-
4,995
3,598
4,140
10.3
10.6
9.0
11.9
32.4
24.5
3.4
3.0
9.9
11.9
1.7
1.4
NBCC
Neutral
215
-
19,350
7,428
9,549
7.9
8.6
8.2
11.0
26.2
19.6
1.3
1.0
28.2
28.7
2.3
1.7
MEP Infra
Neutral
115
-
1,867
1,877
1,943
30.6
29.8
3.0
4.2
38.3
27.4
18.5
12.5
0.6
0.6
2.4
2.2
Stock Watch
August 03, 2017
Company Name
Reco
CMP
Target
Mkt Cap
Sales ( Čcr )
OPM(%)
EPS (Č)
PER(x)
P/BV(x)
RoE(%)
EV/Sales(x)
(Č)
Price ( Č)
( Č cr )
FY17E
FY18E
FY17E
FY18E
FY17E
FY18E
FY17E
FY18E
FY17E
FY18E
FY17E
FY18E
FY17E
FY18E
Construction
SIPL
Neutral
104
-
3,646
1,036
1,252
65.5
66.2
(8.4)
(5.6)
3.9
4.4
(22.8)
(15.9)
11.7
9.8
Engineers India
Neutral
163
-
10,981
1,725
1,935
16.0
19.1
11.4
13.9
14.3
11.7
2.0
1.9
13.4
15.3
5.3
4.7
Financials
Axis Bank
Accumulate
516
580
123,791
46,932
53,575
3.5
3.4
32.4
44.6
16.0
11.6
2.1
1.8
13.6
16.5
-
-
Bank of Baroda
Neutral
163
-
37,604
19,980
23,178
1.8
1.8
11.5
17.3
14.2
9.4
1.6
1.3
8.3
10.1
-
-
Canara Bank
Neutral
360
-
21,473
15,225
16,836
1.8
1.8
14.5
28.0
24.8
12.8
1.7
1.4
5.8
8.5
-
-
Can Fin Homes
Neutral
3,073
-
8,181
420
526
3.5
3.5
86.5
107.8
35.5
28.5
7.7
6.3
23.6
24.1
-
-
Cholamandalam Inv. &
Accumulate
1,170
1,230
18,290
2,012
2,317
6.3
6.3
42.7
53.6
27.4
21.8
4.3
3.7
16.9
18.3
-
-
Fin. Co.
Dewan Housing Finance Buy
461
550
14,448
2,225
2,688
2.9
2.9
29.7
34.6
15.5
13.3
2.5
1.6
16.1
14.8
-
-
Equitas Holdings
Buy
163
235
5,528
939
1,281
11.7
11.5
5.8
8.2
28.2
19.9
2.4
2.2
10.9
11.5
-
-
Federal Bank
Accumulate
115
125
22,354
8,259
8,995
3.0
3.0
4.3
5.6
26.8
20.5
2.3
2.1
8.5
10.1
-
-
HDFC
Neutral
1,766
-
281,305
11,475
13,450
3.4
3.4
45.3
52.5
39.0
33.6
7.5
6.6
20.2
20.5
-
-
HDFC Bank
Neutral
1,795
-
462,148
46,097
55,433
4.5
4.5
58.4
68.0
30.7
26.4
5.4
4.5
18.8
18.6
-
-
ICICI Bank
Accumulate
302
335
193,429
42,800
44,686
3.1
3.3
18.0
21.9
16.8
13.8
2.3
2.1
11.1
12.3
-
-
Karur Vysya Bank
Accumulate
139
160
8,424
5,640
6,030
3.3
3.2
8.9
10.0
15.7
13.9
1.7
1.5
11.2
11.4
-
-
Lakshmi Vilas Bank
Neutral
178
-
3,423
3,339
3,799
2.7
2.8
11.0
14.0
16.2
12.8
1.7
1.5
11.2
12.7
-
-
LIC Housing Finance
Neutral
692
-
34,940
3,712
4,293
2.6
2.5
39.0
46.0
17.8
15.1
3.3
2.8
19.9
20.1
-
-
Punjab Natl.Bank
Neutral
159
-
33,813
23,532
23,595
2.3
2.4
6.8
12.6
23.4
12.6
3.6
2.6
3.3
6.5
-
-
RBL Bank
Neutral
528
-
20,014
1,783
2,309
2.6
2.6
12.7
16.4
41.6
32.2
4.5
4.1
12.8
13.3
-
-
Repco Home Finance
Accumulate
761
825
4,763
388
457
4.5
4.2
30.0
38.0
25.4
20.0
4.2
3.6
18.0
19.2
-
-
South Ind.Bank
Neutral
30
-
5,374
6,435
7,578
2.5
2.5
2.7
3.1
11.0
9.6
1.4
1.2
10.1
11.2
-
-
St Bk of India
Neutral
308
-
265,565
88,650
98,335
2.6
2.6
13.5
18.8
22.8
16.4
2.2
1.9
7.0
8.5
-
-
Union Bank
Neutral
150
-
10,315
13,450
14,925
2.3
2.3
25.5
34.5
5.9
4.4
0.9
0.7
7.5
10.2
-
-
Yes Bank
Neutral
1,830
-
83,701
8,978
11,281
3.3
3.4
74.0
90.0
24.7
20.3
4.7
4.0
17.0
17.2
-
-
FMCG
Akzo Nobel India
Neutral
1,773
-
8,503
2,955
3,309
13.3
13.7
57.2
69.3
31.0
25.6
10.1
8.5
32.7
33.3
2.7
2.4
Asian Paints
Neutral
1,144
-
109,708
17,128
18,978
16.8
16.4
19.1
20.7
59.9
55.3
20.8
19.7
34.8
35.5
6.3
5.7
Britannia
Neutral
3,864
-
46,385
9,594
11,011
14.6
14.9
80.3
94.0
48.1
41.1
19.8
15.3
41.2
-
4.7
4.0
Colgate
Neutral
1,039
-
28,255
4,605
5,149
23.4
23.4
23.8
26.9
43.7
38.6
24.2
18.9
64.8
66.8
6.1
5.4
Dabur India
Neutral
300
-
52,925
8,315
9,405
19.8
20.7
8.1
9.2
37.1
32.7
10.3
8.6
31.6
31.0
6.0
5.3
GlaxoSmith Con*
Neutral
5,426
-
22,821
4,350
4,823
21.2
21.4
179.2
196.5
30.3
27.6
8.0
6.8
27.1
26.8
4.6
4.1
Stock Watch
August 03, 2017
Company Name
Reco
CMP
Target
Mkt Cap
Sales ( Čcr )
OPM(%)
EPS (Č)
PER(x)
P/BV(x)
RoE(%)
EV/Sales(x)
(Č)
Price ( Č)
( Č cr )
FY17E FY18E
FY17E
FY18E
FY17E
FY18E
FY17E
FY18E
FY17E
FY18E
FY17E
FY18E
FY17E
FY18E
FMCG
Godrej Consumer
Neutral
925
-
63,011
10,235
11,428
18.4
18.6
41.1
44.2
22.5
20.9
5.0
4.2
24.9
24.8
6.2
5.5
HUL
Neutral
1,168
-
252,885
35,252
38,495
17.8
17.8
20.7
22.4
56.6
52.2
54.1
46.4
95.6
88.9
7.0
6.4
ITC
Neutral
285
-
346,794
40,059
44,439
38.3
39.2
9.0
10.1
31.8
28.1
8.9
7.7
27.8
27.5
8.2
7.3
Marico
Neutral
327
-
42,134
6,430
7,349
18.8
19.5
6.4
7.7
51.0
42.4
15.4
13.0
33.2
32.5
6.4
5.5
Nestle*
Neutral
6,706
-
64,656
10,073
11,807
20.7
21.5
124.8
154.2
53.7
43.5
22.1
19.8
34.8
36.7
6.2
5.3
Tata Global
Neutral
165
-
10,420
8,675
9,088
9.8
9.8
7.4
8.2
22.3
20.1
1.8
1.7
7.9
8.1
1.1
1.1
Procter & Gamble
Neutral
7,981
-
25,907
2,939
3,342
23.2
23.0
146.2
163.7
54.6
48.8
13.8
11.5
25.3
23.5
8.4
7.3
Hygiene
IT
HCL Tech^
Accumulate
884
1,014
126,103
46,723
52,342
22.1
20.9
60.0
62.8
14.7
14.1
3.7
3.2
25.3
22.4
2.4
2.1
Infosys
Buy
992
1,179
227,960
68,484
73,963
26.0
26.0
63.0
64.0
15.8
15.5
3.3
3.0
20.8
19.7
3.0
2.6
TCS
Accumulate
2,467
2,651
486,174
117,966
127,403
27.5
27.6
134.3
144.5
18.4
17.1
5.5
5.1
29.8
29.7
3.8
3.5
Tech Mahindra
Buy
402
533
39,213
29,141
31,051
14.4
15.0
32.3
35.6
12.4
11.3
2.1
1.9
17.1
17.0
1.2
1.1
Wipro
Neutral
294
-
143,243
55,421
58,536
20.3
20.3
35.1
36.5
8.4
8.1
1.5
1.2
19.2
14.6
2.0
1.7
Media
D B Corp
Neutral
379
-
6,964
2,297
2,590
27.4
28.2
21.0
23.4
18.0
16.2
4.2
3.6
23.7
23.1
2.8
2.4
HT Media
Neutral
89
-
2,064
2,693
2,991
12.6
12.9
7.9
9.0
11.2
9.9
1.0
0.9
7.8
8.3
0.3
0.2
Jagran Prakashan
Buy
176
225
5,745
2,283
2,555
28.0
28.0
10.6
12.3
16.5
14.4
3.5
3.1
21.4
21.4
2.5
2.2
Sun TV Network
Neutral
796
-
31,383
2,850
3,265
70.1
71.0
26.2
30.4
30.4
26.2
7.8
6.9
24.3
25.6
10.6
9.1
Hindustan Media
Neutral
274
-
2,008
1,016
1,138
24.3
25.2
27.3
30.1
10.0
9.1
1.9
1.7
16.2
15.8
1.3
1.1
Ventures
TV Today Network
Buy
242
344
1,442
608
667
21.5
22.3
15.7
19.2
15.4
12.6
2.3
2.0
16.1
16.0
2.0
1.7
Music Broadcast Limited Buy
356
434
2,031
271
317
91.0
109.0
6.0
10.0
59.3
35.6
3.7
3.4
6.5
9.3
7.1
5.8
Metals & Mining
Coal India
Neutral
250
-
155,340
84,638
94,297
21.4
22.3
24.5
27.1
10.2
9.2
4.3
4.1
42.6
46.0
1.3
1.2
Hind. Zinc
Neutral
284
-
119,915
14,252
18,465
55.9
48.3
15.8
21.5
18.0
13.2
2.9
2.6
17.0
20.7
8.4
6.5
Hindalco
Neutral
228
-
51,174
107,899
112,095
7.4
8.2
9.2
13.0
24.8
17.6
1.2
1.1
4.8
6.6
1.0
0.9
JSW Steel
Neutral
220
-
53,118
53,201
58,779
16.1
16.2
130.6
153.7
1.7
1.4
0.2
0.2
14.0
14.4
1.8
1.5
NMDC
Neutral
124
-
39,248
6,643
7,284
44.4
47.7
7.1
7.7
17.5
16.1
1.5
1.5
8.8
9.2
3.7
3.3
SAIL
Neutral
63
-
26,082
47,528
53,738
(0.7)
2.1
(1.9)
2.6
24.3
0.7
0.7
(1.6)
3.9
1.4
1.3
Vedanta
Neutral
281
-
104,435
71,744
81,944
19.2
21.7
13.4
20.1
21.0
14.0
1.8
1.6
8.4
11.3
1.8
1.5
Tata Steel
Neutral
568
-
55,160
121,374
121,856
7.2
8.4
18.6
34.3
30.5
16.6
1.9
1.7
6.1
10.1
1.1
1.1
Oil & Gas
GAIL
Neutral
369
-
62,443
56,220
65,198
9.3
10.1
27.1
33.3
13.6
11.1
1.3
1.2
9.3
10.7
1.3
1.1
ONGC
Neutral
166
-
212,454
137,222
152,563
15.0
21.8
19.5
24.1
8.5
6.9
0.7
0.7
8.5
10.1
1.8
1.6
Stock Watch
August 03, 2017
Company Name
Reco
CMP
Target
Mkt Cap
Sales ( Čcr )
OPM(%)
EPS (Č)
PER(x)
P/BV(x)
RoE(%)
EV/Sales(x)
(Č)
Price ( Č)
( Č cr )
FY17E FY18E
FY17E
FY18E
FY17E
FY18E
FY17E
FY18E
FY17E
FY18E
FY17E
FY18E
FY17E
FY18E
Oil & Gas
Indian Oil Corp
Neutral
370
-
179,717
373,359
428,656
5.9
5.5
54.0
59.3
6.9
6.2
1.1
1.0
16.0
15.6
0.6
0.5
Reliance Industries
Neutral
1,629
-
529,740
301,963
358,039
12.1
12.6
87.7
101.7
18.6
16.0
1.9
1.7
10.7
11.3
2.2
1.9
Pharmaceuticals
Alembic Pharma
Accumulate
536
600
10,101
3,101
3,966
19.7
20.5
21.4
25.5
25.0
21.0
5.3
4.3
23.0
22.8
3.2
2.4
Alkem Laboratories Ltd
Buy
1,796
2,161
21,478
5,853
6,901
17.1
18.4
74.6
85.0
24.1
21.1
5.1
4.3
21.1
20.2
3.6
3.1
Aurobindo Pharma
Accumulate
731
823
42,819
14,845
17,086
21.5
22.1
39.4
44.7
18.6
16.4
4.6
3.6
27.6
24.7
3.0
2.6
Aventis*
Neutral
4,330
-
9,973
2,206
2,508
16.6
16.8
128.9
139.9
33.6
31.0
5.7
4.5
21.6
23.5
4.3
3.6
Cadila Healthcare
Sell
539
450
55,221
9,220
11,584
18.4
20.3
14.5
18.7
37.2
28.8
7.9
6.4
23.5
24.6
6.3
4.8
Cipla
Sell
566
461
45,528
14,281
16,619
15.4
16.2
12.5
19.7
45.3
28.7
3.6
3.3
8.4
12.0
3.4
2.9
Dr Reddy's
Neutral
2,380
-
39,447
14,081
15,937
16.1
18.6
72.6
105.9
32.8
22.5
3.2
2.9
9.6
13.6
3.0
2.7
Dishman Pharma
Sell
143
1,718
1,890
22.7
22.8
9.5
11.3
10.1
10.9
3.3
2.9
GSK Pharma*
Neutral
2,360
-
19,993
2,927
3,290
11.8
16.2
34.4
49.6
68.6
47.6
10.0
10.4
13.9
21.3
6.6
6.0
Indoco Remedies
Sell
202
153
1,857
1,067
1,154
12.1
14.9
8.4
11.3
24.0
17.8
2.9
2.5
12.6
15.0
1.9
1.8
Ipca labs
Buy
477
620
6,021
3,211
3,593
13.9
14.5
15.4
19.4
31.0
24.6
2.5
2.2
8.2
9.5
2.0
1.7
Lupin
Buy
1,034
1,526
46,722
17,120
18,657
24.1
24.1
56.9
61.1
18.2
16.9
3.4
2.9
20.7
18.6
3.0
2.4
Natco Pharma
Accumulate
963
1,060
16,786
2,065
1,988
33.1
33.7
27.9
25.7
34.5
37.5
10.1
8.6
29.2
22.9
8.2
8.3
Sun Pharma
Buy
524
712
125,780
30,264
32,899
29.0
26.9
32.7
31.6
16.0
16.6
3.4
2.9
22.2
18.7
3.9
3.5
Power
Tata Power
Neutral
83
-
22,341
36,916
39,557
17.4
27.1
5.1
6.3
16.2
13.1
1.4
1.3
9.0
10.3
1.6
1.5
NTPC
Neutral
172
-
141,492
86,605
95,545
17.5
20.8
11.8
13.4
14.5
12.8
1.5
1.4
10.5
11.1
3.0
3.0
Power Grid
Neutral
222
-
115,880
25,315
29,193
88.2
88.7
14.2
17.2
15.7
12.9
2.4
2.1
15.2
16.1
9.2
8.3
Real Estate
Prestige Estate
Neutral
270
-
10,134
4,707
5,105
25.2
26.0
10.3
13.0
26.2
20.8
2.1
2.0
10.3
10.2
3.3
3.0
MLIFE
Buy
423
522
2,169
1,152
1,300
22.7
24.6
29.9
35.8
14.1
11.8
1.0
1.0
7.6
8.6
2.6
2.2
Telecom
Bharti Airtel
Neutral
416
-
166,252
105,086
114,808
34.5
34.7
12.2
16.4
34.1
25.4
2.3
2.2
6.8
8.4
2.5
2.2
Idea Cellular
Neutral
92
-
33,266
40,133
43,731
37.2
37.1
6.4
6.5
14.4
14.2
1.2
1.1
8.2
7.6
1.8
1.6
zOthers
Abbott India
Neutral
4,427
-
9,407
3,153
3,583
14.1
14.4
152.2
182.7
29.1
24.2
142.8
122.0
25.6
26.1
2.7
2.3
Asian Granito
Buy
408
480
1,228
1,066
1,169
11.6
12.5
13.0
16.0
31.4
25.6
3.1
2.7
9.5
10.7
1.5
1.3
Bajaj Electricals
Buy
329
395
3,337
4,801
5,351
5.7
6.2
10.4
13.7
31.6
24.1
3.9
3.5
12.4
14.5
0.7
0.6
Banco Products (India)
Neutral
216
-
1,548
1,353
1,471
12.3
12.4
14.5
16.3
14.9
13.3
20.6
18.6
14.5
14.6
1.1
116.4
Coffee Day Enterprises
Neutral
249
-
5,124
2,964
3,260
20.5
21.2
4.7
8.0
-
31.1
2.9
2.6
5.5
8.5
2.1
1.9
Ltd
Competent Automobiles Neutral
223
-
143
1,137
1,256
3.1
2.7
28.0
23.6
8.0
9.4
42.8
38.7
14.3
11.5
0.1
0.1
Stock Watch
August 03, 2017
Company Name
Reco
CMP
Target
Mkt Cap
Sales ( Čcr )
OPM(%)
EPS (Č)
PER(x)
P/BV(x)
RoE(%)
EV/Sales(x)
(Č)
Price ( Č)
( Č cr )
FY17E
FY18E
FY17E
FY18E
FY17E
FY18E
FY17E
FY18E
FY17E
FY18E
FY17E
FY18E
FY17E
FY18E
zOthers
Elecon Engineering
Neutral
62
-
690
1,482
1,660
13.7
14.5
3.9
5.8
15.8
10.6
3.7
3.4
7.8
10.9
0.8
0.7
Finolex Cables
Neutral
481
-
7,359
2,883
3,115
12.0
12.1
14.2
18.6
33.9
25.9
18.0
15.8
15.8
14.6
2.2
2.0
Garware Wall Ropes
Neutral
886
-
1,940
863
928
15.1
15.2
36.4
39.4
24.4
22.5
4.4
3.8
17.5
15.9
2.2
2.0
Goodyear India*
Neutral
899
-
2,074
1,598
1,704
10.4
10.2
49.4
52.6
18.2
17.1
84.0
73.7
18.2
17.0
1.0
140.5
Hitachi
Neutral
2,044
-
5,558
2,081
2,433
8.8
8.9
33.4
39.9
61.2
51.2
49.4
41.1
22.1
21.4
2.7
2.3
HSIL
Neutral
362
-
2,618
2,384
2,515
15.8
16.3
15.3
19.4
23.7
18.7
23.5
20.2
7.8
9.3
1.3
1.2
Interglobe Aviation
Neutral
1,281
-
46,346
21,122
26,005
14.5
27.6
110.7
132.1
11.6
9.7
69.3
49.5
168.5
201.1
2.2
1.7
Jyothy Laboratories
Neutral
373
-
6,776
1,440
2,052
11.5
13.0
8.5
10.0
43.9
37.3
10.6
9.8
18.6
19.3
5.0
3.5
Kirloskar Engines India
Neutral
400
-
5,777
2,554
2,800
9.9
10.0
10.5
12.1
38.1
33.0
15.9
15.0
10.7
11.7
1.9
1.7
Ltd
Linc Pen & Plastics
Neutral
263
-
389
382
420
9.3
9.5
13.5
15.7
19.5
16.7
3.3
2.9
17.1
17.3
1.1
1.0
M M Forgings
Neutral
600
-
724
546
608
20.4
20.7
41.3
48.7
14.5
12.3
82.2
72.7
16.6
17.0
1.2
1.1
Manpasand Bever.
Neutral
788
-
4,507
836
1,087
19.6
19.4
16.9
23.8
46.6
33.1
5.6
4.9
12.0
14.8
5.1
3.9
Mirza International
Neutral
162
-
1,947
963
1,069
17.2
18.0
6.1
7.5
26.4
21.6
4.0
3.4
15.0
15.7
2.2
2.0
MT Educare
Neutral
68
-
272
366
417
17.7
18.2
9.4
10.8
7.3
6.3
1.6
1.4
22.2
22.3
0.6
0.5
Narayana Hrudaya
Neutral
309
-
6,318
1,873
2,166
11.5
11.7
2.6
4.0
116.9
78.0
7.2
6.5
6.1
8.3
3.5
3.0
Navkar Corporation
Buy
200
265
2,854
347
371
43.2
37.3
6.7
6.0
30.0
33.4
2.1
1.8
6.2
10.6
9.3
8.7
Navneet Education
Neutral
167
-
3,899
1,062
1,147
24.0
24.0
6.1
6.6
27.4
25.2
5.6
5.0
20.6
19.8
3.8
3.5
Nilkamal
Neutral
1,844
-
2,752
1,995
2,165
10.7
10.4
69.8
80.6
26.4
22.9
105.4
91.5
16.6
16.5
1.4
1.2
Page Industries
Neutral
16,875
-
18,822
2,450
3,124
20.1
17.6
299.0
310.0
56.4
54.4
375.8
286.9
47.1
87.5
7.7
6.1
Parag Milk Foods
Neutral
254
-
2,136
1,919
2,231
9.3
9.6
9.5
12.9
26.9
19.6
4.2
3.4
15.5
17.5
1.3
1.1
Quick Heal
Neutral
211
-
1,483
408
495
27.3
27.0
7.7
8.8
27.3
24.0
2.5
2.5
9.3
10.6
2.8
2.3
Radico Khaitan
Neutral
149
-
1,986
1,667
1,824
13.0
13.2
6.7
8.2
22.5
18.2
2.0
1.9
9.0
10.2
1.6
1.4
Relaxo Footwears
Neutral
465
-
5,585
2,085
2,469
9.2
8.2
7.6
8.0
61.5
58.5
23.8
20.4
17.9
18.8
2.8
2.4
S H Kelkar & Co.
Neutral
267
-
3,861
1,036
1,160
15.1
15.0
6.1
7.2
43.7
37.2
4.7
4.3
10.7
11.5
3.6
3.2
Siyaram Silk Mills
Buy
2,092
2,500
1,961
1,574
1,769
12.5
12.7
97.1
113.1
21.5
18.5
3.3
2.9
15.4
15.5
1.5
1.3
Styrolution ABS India*
Neutral
1,050
-
1,846
1,440
1,537
9.2
9.0
40.6
42.6
25.9
24.6
66.0
60.0
12.3
11.6
1.2
1.1
Surya Roshni
Neutral
279
-
1,223
3,342
3,625
7.8
7.5
17.3
19.8
16.2
14.1
30.7
24.6
10.5
10.8
0.6
0.6
Team Lease Serv.
Neutral
1,425
-
2,436
3,229
4,001
1.5
1.8
22.8
32.8
62.6
43.4
6.7
5.8
10.7
13.4
0.7
0.5
The Byke Hospitality
Neutral
203
-
813
287
384
20.5
20.5
7.6
10.7
26.7
19.0
5.6
4.5
20.7
23.5
2.9
2.1
Stock Watch
August 03, 2017
Company Name
Reco
CMP
Target Mkt Cap
Sales ( Čcr )
OPM(%)
EPS (Č)
PER(x)
P/BV(x)
RoE(%)
EV/Sales(x)
(Č)
Price ( Č)
( Č cr )
FY17E FY18E FY17E FY18E FY17E FY18E FY17E FY18E FY17E FY18E FY17E FY18E FY17E FY18E
zOthers
Transport Corporation of
Neutral
304
-
2,330
2,671
2,911
8.5
8.8
13.9
15.7
22.0
19.4
3.0
2.7
13.7
13.8
1.0
0.9
India
TVS Srichakra
Neutral
3,761
-
2,880
2,304
2,614
13.7
13.8
231.1
266.6
16.3
14.1
422.6
332.7
33.9
29.3
1.3
1.1
UFO Moviez
Neutral
370
-
1,022
619
685
33.2
33.4
30.0
34.9
12.4
10.6
1.7
1.5
13.8
13.9
1.4
1.0
Visaka Industries
Neutral
486
-
772
1,051
1,138
10.3
10.4
21.0
23.1
23.1
21.0
62.3
58.3
9.0
9.2
1.0
0.9
VRL Logistics
Neutral
324
-
2,955
1,902
2,119
16.7
16.6
14.6
16.8
22.2
19.3
4.9
4.3
21.9
22.2
1.7
1.5
VIP Industries
Buy
179
218
2,535
1,270
1,450
10.4
10.4
5.6
6.5
32.0
27.6
6.6
5.8
20.7
21.1
2.0
1.7
Navin Fluorine
Neutral
758
-
3,735
789
945
21.1
22.4
24.0
28.7
31.6
26.4
5.1
4.4
17.8
18.5
4.7
3.8
Source: Company, Angel Research; Note: *December year end; #September year end; &October year end; Price as on August 02, 2017
Market Outlook
August 03, 2017
Research Team Tel: 022 - 39357800
DISCLAIMER
Angel Broking Private Limited (hereinafter referred to as “Angel”) is a registered Member of National Stock Exchange of India
Limited,Bombay Stock Exchange Limited and Metropolitan Stock Exchange Limited. It is also registered as a Depository Participant with
CDSL and Portfolio Manager with SEBI. It also has registration with AMFI as a Mutual Fund Distributor. Angel Broking Private Limited is a
registered entity with SEBI for Research Analyst in terms of SEBI (Research Analyst) Regulations, 2014 vide registration number
INH000000164. Angel or its associates has not been debarred/ suspended by SEBI or any other regulatory authority for accessing
/dealing in securities Market. Angel or its associates/analyst has not received any compensation / managed or
co-managed public offering of securities of the company covered by Analyst during the past twelve months.
This document is solely for the personal information of the recipient, and must not be singularly used as the basis of any investment
decision. Nothing in this document should be construed as investment or financial advice. Each recipient of this document should make
such investigations as they deem necessary to arrive at an independent evaluation of an investment in the securities of the companies
referred to in this document (including the merits and risks involved), and should consult their own advisors to determine the merits and
risks of such an investment.
Reports based on technical and derivative analysis center on studying charts of a stock's price movement, outstanding positions and
trading volume, as opposed to focusing on a company's fundamentals and, as such, may not match with a report on a company's
fundamentals. Investors are advised to refer the Fundamental and Technical Research Reports available on our website to evaluate the
contrary view, if any.
The information in this document has been printed on the basis of publicly available information, internal data and other reliable
sources believed to be true, but we do not represent that it is accurate or complete and it should not be relied on as such, as this
document is for general guidance only. Angel Broking Pvt. Limited or any of its affiliates/ group companies shall not be in any way
responsible for any loss or damage that may arise to any person from any inadvertent error in the information contained in this report.
Angel Broking Pvt. Limited has not independently verified all the information contained within this document. Accordingly, we cannot
testify, nor make any representation or warranty, express or implied, to the accuracy, contents or data contained within this document.
While Angel Broking Pvt. Limited endeavors to update on a reasonable basis the information discussed in this material, there may be
regulatory, compliance, or other reasons that prevent us from doing so.
This document is being supplied to you solely for your information, and its contents, information or data may not be reproduced,
redistributed or passed on, directly or indirectly.
Neither Angel Broking Pvt. Limited, nor its directors, employees or affiliates shall be liable for any loss or damage that may arise from
or in connection with the use of this information.